Testosterone Reference Ranges – What Should Be Considered “Normal” & Why?

To many reading this, you’ve undoubtedly been told by your doctor that your Testosterone was “normal”, when it clearly fell in line with BSSM recommendations for treatment. Concurrent with this, you may have been mildly symptomatic and had clear indications of a worsening metabolic profile from other biomarkers such as HbA1c and a cholesterol panel. Often to the confusion and annoyance of the patient, they’re dismissed and labelled as otherwise normal, with no further investigations being performed to identify if they are indeed hypogonadal and what the cause may be; is it a reversible cause? Some may be prescribed anti-depressants if symptomatic with depression, and statins if presenting a poor metabolic profile, only serving to make the problem worse and ignoring the underlying issues.
Conversely, you may have had Testosterone levels 1 standard deviation outside the reference range, either naturally or on TRT, and be told that this is dangerous, even though you present no clear physiological complications secondary to elevated Testosterone and that this may well be normal for you. Some may have had an ideal experience and had none of these issues. Rest assured that I am not promoting that if your levels fall to the lower end of a reference range, you should be given TRT and that if they fall in the upper range, TRT should be stopped; I am in no way promoting TRT or inappropriate and dangerous misuse of Testosterone. Instead, I want to highlight the issues that are central to the use of a reference range, almost as if it’s a holy scripture, without first questioning what it represents and why it’s merely a ‘reference’.
So, this will require a head dive into some basic university level statistics; I’ll provide a high and low-level explanation. Following this, I’ll review literature on the topic of Testosterone and what different concentrations of it do regarding health outcomes. I’ll also be asking if we need to consider other variables first, such as exercise level?
Back To University & A-Level Maths: Normal Distribution, The High-Level View
Even with my love and passion for science (including Quantum Physics and classical mechanics!), I still struggled with Maths. So I appreciate how difficult it can be to remember and grasp even the most basic of concepts for those less mathematically able, such as myself. But these are important principles that we need to revisit.
Anyone that’s done a life sciences, physics, computer science, medical, or social degree may appreciate how fundamental probability statistics are. Of most importance is this notion of a normal distribution.
Normal Distribution – What’s Normal Anyway?
In statistics, there are two numerical data types: continuous data and categorical data 1.
- CONTINUOUS data will describe the quantity of measurement along a scale, e.g. height, or temperature.
- CATEGORICAL data will describe data that takes on a limited, and normally fixed, number of possible values. Each individual, or unit of observation, will be assigned to a certain group or nominal category dependent on the qualitative property of the variable in question. For example, the number of people that fit into a symptomatic category, or the number of people who prefer chocolate, vanilla, or strawberry (who doesn’t like strawberry?). Or a simpler ‘yes’ versus ‘no’ question would constitute a categorical data type.
Both measurements are inclusive of the measure of central tendency and the measure of dispersion. The measure of central tendency is the direction towards the central most value of a given data set, as provided by either the mean or median. The measure of dispersion includes the standard deviation (SD), standard error, and confidence intervals (CI).
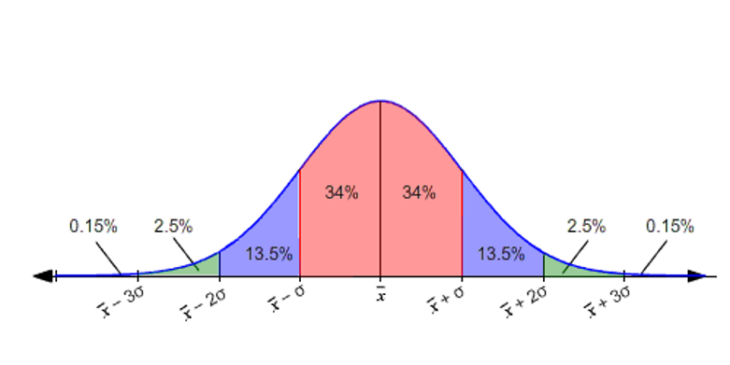
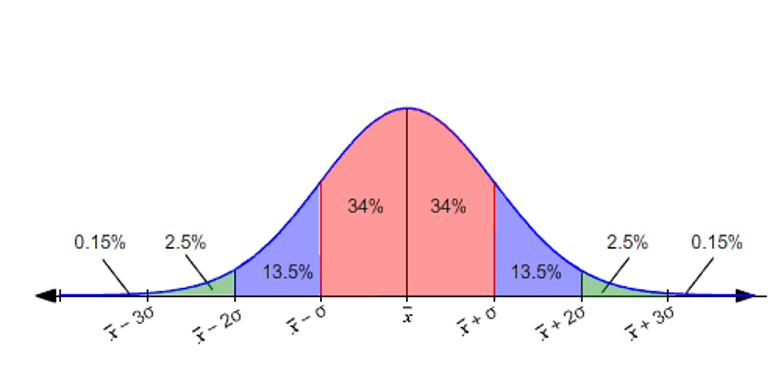
Now, how we represent this data depends upon the data type we have; categorical data will have a binomial distribution as its outcome is binary (e.g. Yes/No, Normal or Diseased). Conversely, with continuous data, there’s distribution of the data on either side of the mean (representing the measure of central tendency) and is given by the SD (measure of dispersion). If this distribution follows a bell-shape, it’s deemed ‘normal’. It’d look like this (click for full-size image):
Where we can see the measure of dispersion in percentage away from the mean ( X̄ ) and we can note that about 95% (pink and blue shaded areas, 34 % + 34% + 13.5 % + 13.5% ) of the values will lie within 2 SDs of the mean, which is between (X̄ – 2σ) and (X̄ + 2σ).
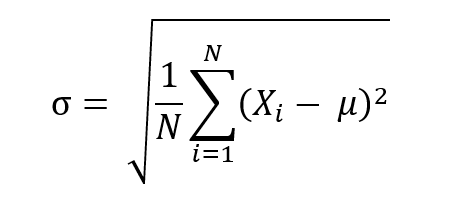
Let’s presume we’ve a sample group of 5 healthy men, with the measurement of Testosterone being 282 ng/dL or 9.78 nmol/L , 383 ng/dL or 13.29 nmol/L, 430 ng/dL or 14.92 nmol/L, 630 ng/dL 21.86 nmol/L, and 1008 ng/dL or 34.97 nmol/L. The mean Testosterone value would be (282 + 383 + 430 + 630 + 1008 = 2,723, which divided by 5 is 544.6) 544.6 ng/dL, or 18.89 nmol/L . This data is also mostly normally distributed as per a Kolomogorov-Smirnov (K-S) test of normality, which gives us a D value of 0.27498, well below the significant P value of 0.75973. Though, it does have a distribution that’s too peaked with a kurtosis and skewness slightly above 1 at 1.30 and 1.38, respectively 2. Nonetheless, we’ll use this data for the purposes of demonstration, and we want to know what 2SD would be to fit into our range. We can do this via using the following formula, where the symbols mean the following:
- is population standard deviation
- N is the size of the population
- is each value from the population
- is the population mean
In our case, we have a sample group, so we use the following formula, where S is the sample standard deviation:
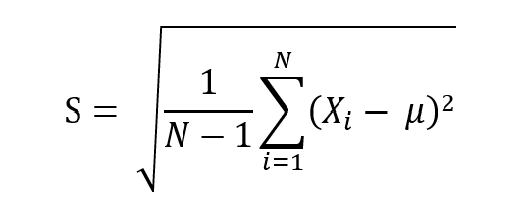
We can break this down as follows:
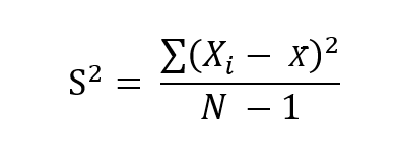
Which is the same as:
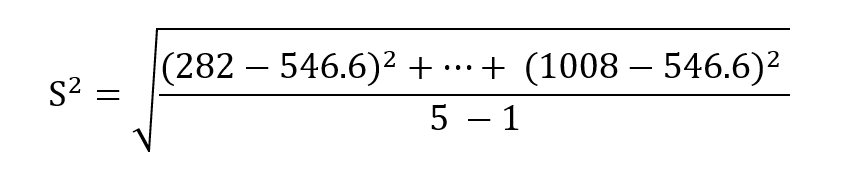
Which gives us 287.323 ng/dL or 9.97 nmol/L for 1 standard deviation. This means that if we were 3 standard deviations above our mean, we’d be at a total testosterone level of 1,408.569 ng/dL or 48.87 nmol/L and respectively castrate if we were 3SD below the mean. But this sample size immediately faces the issue of being too small to have a significant effect; we also are unaware of what exclusion criteria were used as this data is imaginary.
In the real world, neither our population mean, nor our population standard deviation are actually known (we can’t measure everyone just yet); they need to be estimated from a sample. The 95% interval that we wish to identify will require us to normally estimate the population standard deviation and the population mean from the sample standard deviation and the sample mean, respectively. To account for our estimations, the 95% prediction interval can be calculated as follows:
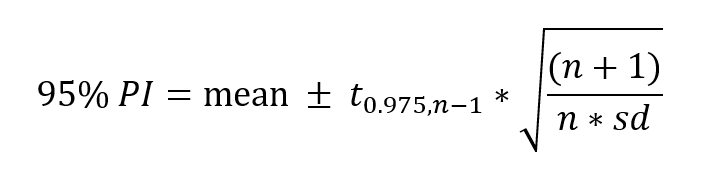
Where is the 97.5% quantile of a Students t-distribution with n-1 degrees of freedom (number of values in the final calculation of a statistic that are free to vary). We can also use logarithmized values, but that’s beyond the scope of this article. From this we can calculate the upper and lower limits. This requires the calculation of the squared deviation from the mean of each individual measurement. Nonetheless, for the purposes of this article, use of non-Students T-distribution is fine.
The reference range produced will also vary with diet, exercise levels, age, and use of supplements, stress, and other drugs. In the case of Testosterone, there’s also the consideration of the time of day that it’s being measured, where it’s highest in the morning. These factors are not often considered and result in inaccurate reference rages.
Back To University & A-Level Maths: Normal Distribution, The High-Level View
We first need to understand some basic concepts, the mode, median, and mean:
- Mode: Category with the highest frequency. For example, the greatest number of times you saw a particular height appear in a cohort of 1000 men that you measured, maybe those 5’10 appeared 100 times which was the highest count.
- Median: Where you order all the numbers from minor to major (or vice-versa), which is the individual measurement that’s exactly in the middle.
- Mean: This is the sum of all the values divided by the number of values summed.
Normal distribution, the bell-shaped curve graph in the above section, occurs when the mode, median, and mean are all the same value. There’s a standard deviation too, which is the average distance between any given number in the distribution and the mean. So, there will be exactly 50% of the data at each side of the central value, meaning it’s symmetrical. If we take the mean as the starting point and move stepwise with each standard deviation, we will know exactly how much data is contained within that range.
The normal distribution can tell us a few things, including what the most frequent values are and how far apart they are (the closer the values are, the taller the bell curve shape, and the smaller the further apart they are). The most frequent values will lie about the mean and we can say this with a higher confidence than values further away from the mean.
Reference Ranges – The Considerations
When measuring Testosterone to produce a reference range against the normal distribution of data, we need to firstly have a significant sample size, and secondly define what constitutes normal and healthy; what is our exclusion criteria? Are we considering symptoms, alongside comorbidities, and full blood panels? Are the participants fit and physically able, too? What’s their blood pressure and heart rate? What age range are we using? What ethnic population are we using and is there a variation between populations due to genetic factors?
These are questions that need to be addressed, and often we struggle to find where this data has come from, which seemingly varies hospital to hospital and lab to lab. ) For example, a large observational study using men from the Framingham Heart Study (generation 2 and 3), Osteoporotic Fractures in Men Study (MrOS) and European Male Aging Study (EMAS) used a range of 456 men that were 19-40 years old and were considered healthy, with a finding of the mean (SD) being 723.8 ng/dL or 25.11 nmol/L (221.1ng/dl or 7.67 nmol/L) , the median (quartile) being 698.7 ng/dL or 24.24 nmol/L (296.5 ng/dL or 10.28 nmol/L), and the 2.5th percentile being 348.3 ng/dL or 12.08 nmol/L for total Testosterone, and 141.8 (45.0), 134.0 (60.0), and 70.0 pg/ml for FT, respectively. This means that men 2SD above the mean would be at levels of 1166 ng/dL or 40.46 nmol/L, and for the lower limits, they’d be at levels as low as 281.8 ng/dL or 9.77 nmol/L. That means we can fit 98% of the sample into the normal distribution. This study has a much more stringent exclusion criteria, excluding those above 40 years, and those with cancer, cardiovascular disease, general cardiometabolic disorders, on TRT, or antiandrogens, diabetes mellitus, obesity, hypertension, hypercholesterolemia, and smoking. However, only in the MrOS and EMAS were physical function measures included, and only sexual symptoms recorded in the EMAS. Nonetheless, these randomized results provided a good idea of what the normal healthy reference range for Total Testosterone and Free Testosterone should be in adult men of ages 19-40 3.
It’s important for clinicians to consider that it’s well and truly possible to be above or below 1 to 2 SDs, potentially even 3, while still being healthy; not everything must exist solely within the range of what would be considered physiological, if the reference range is indeed derived from a well-constructed study.
But, again, we need to recollect that those existing 2 or 3 SD above or below that are asymptomatic only represent a combined 5% of the sample size population in a two tailed direction; they’re rare and will represent a statistically significantly deviation from the norm. Does this mean we should automatically make a clinical decision if they’re above the reference range by 2SD, or maybe even 3SD ? Well, reference ranges vary sample size to sample size, so we may well be wrong with what’s normal. Furthermore, we shouldn’t do this without ascertaining whether they’re symptomatic and furthermore, what their cardiometabolic profile looks like. We are well aware that there’s a clear association between Testosterone levels and cardiometabolic profile; we need to investigate this in depth to determine their overall health status 3.
Also, to reiterate, the reference range proposed has not been constructed into separate age-groups; we should separate our references by age, as it’s already well known that Testosterone declines with age, and SHBG increases in-part due to decline in the responsiveness of Leydig cells to LH with age and reduced hypothalamic function 4. It is therefore unreasonable to assess a 20-year olds Sex-steroid levels against that of a healthy 50-year-old, and vice versa.
What Is Supraphysiological & What Are The Issues With This?
Supra is a prefix which denotes a position above the part that’s indicated by the word to which it’s joined to. So, by this understanding, it’s the same as super. Superman is beyond the capabilities of a normal man as he is super. Therefore, by the same definition, supraphysiological would of course mean beyond a physiological range.
So, what makes something supraphysiological, statistically speaking? Well, we’ve just elucidated that there’s bias with composing a reference range; outliers will exist. But, with reference to the normal distribution and thus an expected normal population, supraphysiological will refer to anything significantly outside a reference range. One would expect this to be beyond +3SD, depending on the statistical significance threshold used.
We can’t measure everyone, though. So, we can’t state with full confidence what supraphysiological is quantitatively, but on average it’ll be anything out of the upper range by +1SD. This is not an excuse to increase a patient’s dose beyond a reference range, though. It comes with severe risks.
The Issues
This is a topic that’s generally relatively difficult to study due to ethical limitations of using supraphysiological doses of Testosterone in a study. Nonetheless, there are reported studies using high doses. One placebo-controlled, double-blind crossover study looking at the psychiatric effects of intramuscular testosterone cypionate, with dosages rising upwards to 600mg/WK, was performed in 56 normal men. There were statistical increases in all physiological and laboratory measures, including reductions in HDL, increases in prolactin, decreases in gonadotropins, increases in urine pH, increases in white blood cell count, haematocrit, haemoglobin, and systolic blood pressure. Lean body mass also increased. Ratings of manic and aggression symptoms also increased, though non-uniformly across individuals; so supraphysiological Testosterone dosages affects men differently, as one would expect 5.
But this is with usage of absurdly high doses of Testosterone, into the realms of abuse; this isn’t applicable to normal hypogonadal men in need of TRT.
So, What Effects Does High Testosterone Have If Slightly Above The Upper Range?
This is a question that’s difficult to answer due to the obvious issue that everyone will respond differently. The outcome will be dose dependent and similar to what we see in the aforementioned supraphysiological study, in certain individuals.
This also depends on the age and if any comorbidities are present, in older men at least it’s suggested to maintain levels between 400 to 500 ng/dL (14.0 to 17.5 nmol/L) and if symptoms aren’t resolved to raise levels higher, as necessary to resolve symptoms without causing adverse changes in associated biomarkers including cholesterol, blood (i.e. haematocrit exceeding 54%), liver, PSA, and kidney blood panels 6. This must be monitored concurrent with SHBG and free testosterone, too. We do not want to significantly reduce SHBG given its metabolic protective effects. Further information on SHBG can be found here.
What Constitutes Low Testosterone & What Are The Associated Health Outcomes?
Well, studies suggest anything less than 300 ng/dL (10.4 nmol/L) were defined as being low, and anything 300 to 500 ng/dL (10.4 to 17.5 nmol/L) may be considered or treatment with TRT provided FT is lower than expected and the patient is symptomatic. There are several clinical signs and symptoms which are associated with testosterone deficiency, as shown in Table 1 (click for full-size image):
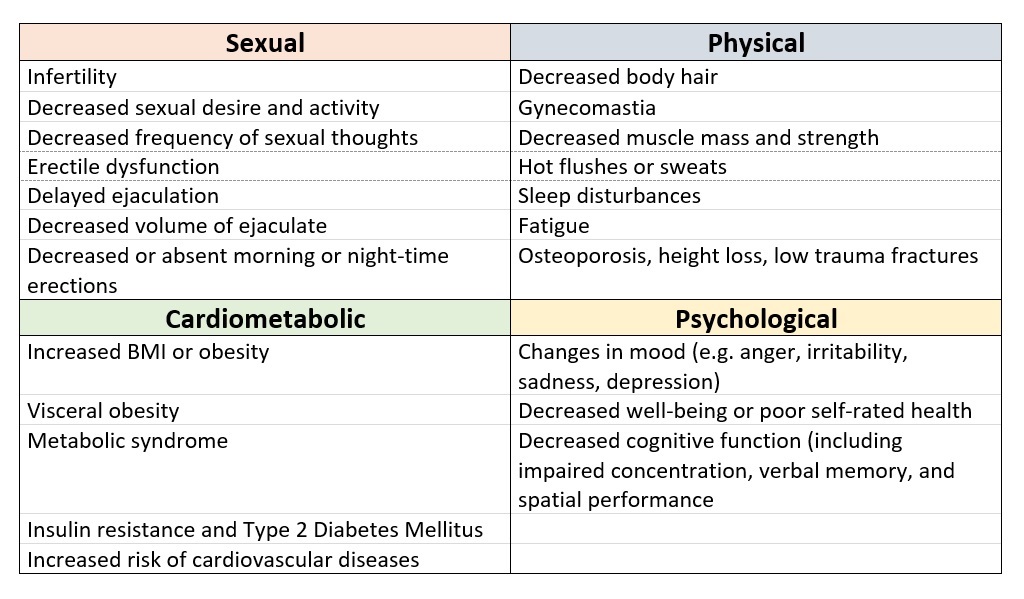
Table 1 – Clinical signs & symptoms associated with testosterone deficiency, adapted from Hackett et al., 2017 7
So, it’s essential we treat patients who have low Testosterone, associated comorbidities and poor laboratory results, AND symptoms. If asymptomatic and otherwise having normal laboratory results (biomarkers related to testosterone), there’s no need to treat them. Once again, it’s important to remember that age should be considered, and reference ranges should be taken merely as a reference. We need to ensure that this range is relevant for the age group of our patients. As such, it’s therefore important to only use the reference range as a mere guide to assess whether a patient should be a candidate for TRT or not, concurrent with assessment of symptoms and cardiometabolic laboratory work.
What Do Clinicians Really Need To Think About Here?
It’s not essential for clinicians to be in agreement until scientific consensus is met with solid evidence and rigorous testing. The unfortunate truth is that men’s sexual health is still relatively understudied with regard to hypogonadism. Nonetheless, the take home message is very clear from this blog; the reference range is simple a reference and there is no cause for immediate alarm if a patient is ±3SD provided that their laboratory work and symptoms are otherwise normal. It’s essential to also assess the history of the patient, if for example they’re well outside the reference range on TRT even post protocol adjustment, try ascertaining the cause i.e. injection technique or accidentally drawing more volume than prescribed. If you notice an out of range value that’s significantly elevated or low, then spend more time with the patient to identify possible symptoms and further evaluate their blood work. Irrespective, it’s important to assess their symptoms.
While we will strive to not have a patients Testosterone be elevated beyond the reference range, it may well be necessary in some instances when considering age, symptoms, cardiometabolic laboratory work, and physiological results including blood pressure, body composition (including visceral fat), and arterial luminal diameter (if measured). We want these values to be physiological and if they’re not, we need to ascertain if it’s a result of inappropriate Testosterone dose, or another cause.
The underlying message is clear: A patient’s testosterone level should be optimised for that patient and that patient alone; there isn’t a one size fits all model as one would expect from a normal distribution. We need to give enough Testosterone to balance and reverse the negative symptoms of low Testosterone without causing negative health outcomes. We need to ensure the patient has a balanced protocol.
References
- Krithikadatta J. Normal Distribution. J Conserv Dent. 2014;17(1):96-97. doi:10.4103/0972-0707.124171
- How to Interpret Excess Kurtosis and Skewness | SmartPLS. https://www.smartpls.com/documentation/functionalities/excess-kurtosis-and-skewness. Accessed February 16, 2020.
- Bhasin S, Pencina M, Jasuja GK, et al. Reference ranges for testosterone in men generated using liquid chromatography tandem mass spectrometry in a community-based sample of healthy nonobese young men in the framingham heart study and applied to three geographically distinct cohorts. J Clin Endocrinol Metab. 2011;96(8):2430-2439. doi:10.1210/jc.2010-3012
- Golan R, Scovell JM, Ramasamy R. Age-related testosterone decline is due to waning of both testicular and hypothalamic-pituitary function. Aging Male. 2015;18(3):201-204. doi:10.3109/13685538.2015.1052392
- Pope HG, Kouri EM, Hudson JI. Effects of supraphysiologic doses of testosterone on mood and aggression in normal men: A randomized controlled trial. Arch Gen Psychiatry. 2000;57(2):133-140. doi:10.1001/archpsyc.57.2.133
- Bassil N, Alkaade S, Morley JE. The benefits and risks of testosterone replacement therapy: A review. Ther Clin Risk Manag. 2009;5(1):427-448. doi:10.2147/tcrm.s3025
- Hackett G, Kirby M, Edwards D, et al. British Society for Sexual Medicine Guidelines on Adult Testosterone Deficiency, With Statements for UK Practice. 2017. doi:10.1016/j.jsxm.2017.10.067

